0

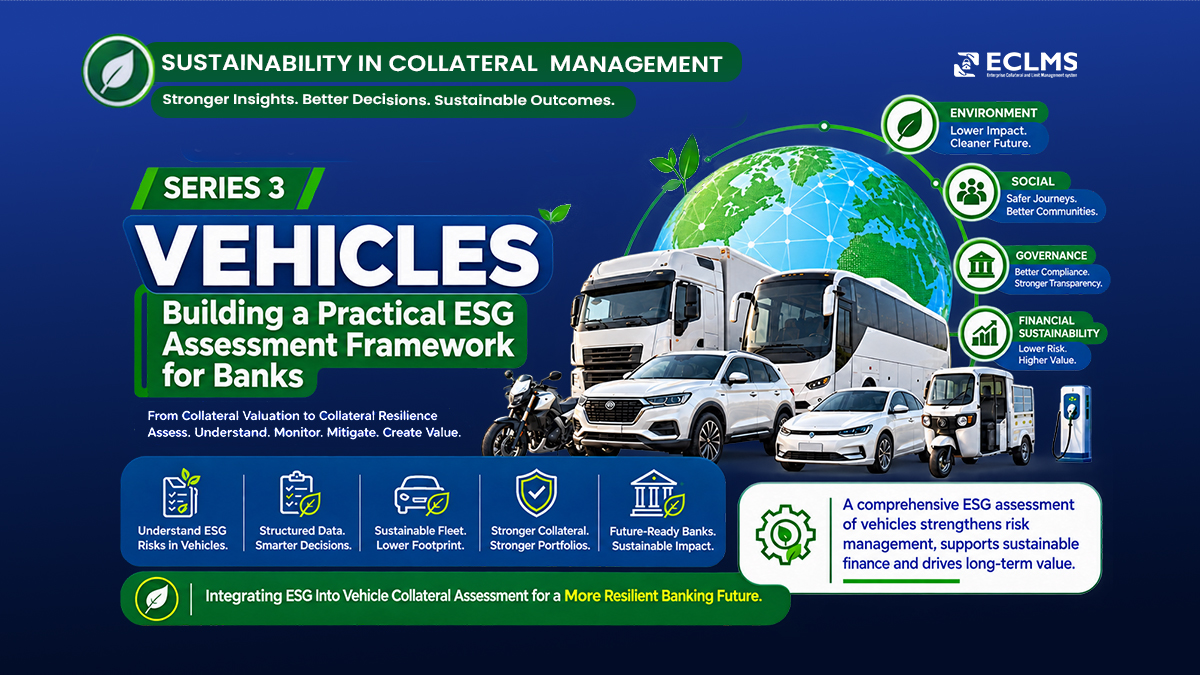
Sustainability & Collateral Management – Vehicles

Vehicles as Collateral: What ESG Information Should Banks Capture?

Vehicle finance represents one of the most widespread forms of secured lending—from personal cars and two-wheelers to commercial fleets, buses, trucks and specialised industrial vehicles.

Traditionally, banks assess vehicle collateral through parameters such as make, model, age, registration, ownership, insurance, market value and depreciation.

These remain fundamental. But as sustainability considerations become increasingly relevant to financial institutions, another question emerges:

Should banks also understand the sustainability characteristics of the vehicles they finance and hold as collateral?

In our opinion, increasingly yes—but the assessment needs to remain practical, proportionate and relevant to lending and collateral risk.

Vehicle ESG Assessment Is More Than EV vs ICE

The first sustainability distinction that comes to mind is usually:

Electric Vehicle or Internal Combustion Engine Vehicle?

That is important, but it is only the starting point.

Two diesel commercial vehicles of similar age and value may have very different emission standards, fuel efficiency, utilisation patterns and remaining economic lives.

Similarly, two electric vehicles may differ significantly in battery technology, battery health, remaining warranty, charging compatibility and expected residual value.

For a banker, the sustainability framework should therefore focus on information that could influence the vehicle’s economic life, regulatory acceptability, operating viability, marketability and residual value.

What Information Should Banks Capture?

I believe a common vehicle sustainability dataset should cover the following broad areas:

  • Vehicle Identity & Classification
  • Propulsion & Fuel Technology
  • Emission & Environmental Performance
  • Energy / Fuel Efficiency
  • Vehicle Age & Remaining Useful Life
  • Regulatory & Environmental Compliance
  • Safety & Social Parameters
  • Insurance & Climate Protection
  • Maintenance & Operating Condition
  • End-of-Life & Circularity
  • Green / Sustainable Finance Classification
  • ESG & Sustainability Risk Indicators

The detailed data requirement can then vary according to whether the financed asset is a personal vehicle, commercial vehicle, fleet or specialised industrial vehicle.

Personal Vehicles: Keep It Proportionate

For a personal car or two-wheeler loan, an extensive ESG questionnaire would neither be practical nor proportionate.

The bank can concentrate on a relatively small dataset covering:

  • Fuel/propulsion type
  • Emission standard
  • Fuel or energy efficiency
  • Vehicle age
  • EV battery information, where applicable
  • Insurance
  • Regulatory compliance
  • Green vehicle classification

Much of this information may already be available through vehicle documentation and the loan-origination process.

The objective should therefore be data enrichment—not additional customer paperwork.

Commercial Vehicles Require Deeper Assessment

The sustainability dimension becomes considerably more important for trucks, buses, taxis, delivery vehicles and commercial fleets because their utilisation and environmental footprint can be substantially higher.

In addition to the common dataset, banks may consider information relating to:

  • Annual kilometres travelled
  • Fuel consumption
  • Load/capacity utilisation
  • Emission performance
  • Maintenance history
  • Fleet age
  • Route and operating profile
  • Alternative-fuel readiness

At the fleet level, the bank can potentially derive indicators such as EV share, low-emission vehicle share, average fleet age, fuel mix and fleet transition progress.

This begins to convert individual collateral data into meaningful portfolio intelligence.

Industrial & Special-Purpose Vehicles Need Another Layer

The same questionnaire cannot reasonably assess a passenger car, an excavator and a large mining dumper.

Industrial and specialised assets such as excavators, loaders, cranes, forklifts, construction equipment, mining vehicles and agricultural equipment require additional consideration of:

  • Engine and propulsion technology
  • Fuel consumption
  • Operating hours
  • Energy efficiency
  • Emission standards
  • Equipment age
  • Maintenance condition
  • Remaining economic life
  • Availability of lower-emission alternatives

This reinforces an important principle:

Vehicle sustainability assessment should be asset-category driven.

EVs Introduce a New Collateral Dimension—the Battery

For electric vehicles, the battery can represent a significant component of both the vehicle’s economic value and sustainability profile.

Banks may therefore progressively need visibility into:

Battery Type | Capacity | Age | Health | Remaining Warranty | Ownership | Replacement Economics | Recycling / Second-Life Potential

Over time, battery condition could become relevant not only to ESG assessment but also to vehicle valuation and residual-value estimation.

Safety Is Also Part of ESG

Vehicle sustainability should not be viewed only through the environmental lens.

The Social dimension can include vehicle and operator safety.

Depending upon the vehicle category, relevant information may include safety rating, mandatory safety features, accident history, fitness certification, inspection status and driver-assistance systems.

For buses, trucks and industrial vehicles, operational safety assumes even greater importance.

Don’t Create Another Manual Data-Collection Exercise

One of the most important design principles should be:

Do not ask the borrower to provide information that the bank can reliably obtain elsewhere.

Vehicle sustainability information can potentially be assembled from:

  • Loan origination data
  • Vehicle registration and documentation
  • Manufacturer specifications
  • Insurance information
  • Inspection and valuation data
  • Commercial-fleet telematics
  • External databases / APIs
  • Customer-reported information
  • System-derived calculations

The collateral management platform should progressively bring this information together, rather than create another standalone questionnaire.

From Individual Vehicles to Portfolio Intelligence

Once structured sustainability information becomes available, banks can potentially analyse their vehicle collateral portfolios across dimensions such as:

  • EV versus ICE exposure
  • Fuel-type distribution
  • Emission-standard distribution
  • Average age of vehicle collateral
  • High-emission vehicle exposure
  • Green vehicle financing
  • Battery-related collateral exposure
  • Commercial fleet transition risk
  • Vehicles approaching technological or economic obsolescence

This is where sustainability data begins to move from data collection to risk intelligence.

The Banker’s Perspective: Proportionality Matters

The purpose should not be to transform every vehicle loan into a complex ESG assessment.

A practical framework could follow:

Personal Vehicle → Lightweight Sustainability Dataset

Commercial Vehicle → Enhanced ESG + Utilisation Dataset

Fleet Finance → Vehicle + Portfolio Sustainability Assessment

Industrial / Special-Purpose Vehicle → Equipment-Specific ESG Assessment

The depth of assessment should reflect the nature, value, usage, environmental impact and risk characteristics of the financed asset.

From Vehicle Value to Vehicle Resilience

Traditional vehicle collateral management asks:

“What is this vehicle worth today?”

A sustainability-enabled framework introduces additional questions:

How efficient is the vehicle?

How environmentally and regulatorily compliant is it?

How long will its technology remain economically viable?

Could transition towards cleaner technologies accelerate its depreciation?

Could these factors influence its future marketability and residual value?

Ultimately, the more relevant question for the lender may become:

“How resilient is the value of this vehicle over the remaining life of the bank’s exposure?”

That is where sustainability becomes relevant to collateral management.

The objective is not ESG data collection for its own sake.

It is a gradual progression from:

Collateral Identification → Valuation → Monitoring → Sustainability Assessment → Collateral Resilience

This is Series 3 of Sustainability in Collateral Management.

I am sharing this as a generic working framework with the broader banking, vehicle-finance, risk, ESG, sustainability and collateral-management community rather than as a prescribed methodology.

Views and practitioner perspectives on what additional sustainability information banks should consider for vehicle collateral would be most welcome.

An overall snapshot summarises the proactive approach to vehicle finance vis a vis sustainable finance.

Article content

#CollateralManagement #VehicleFinance #ESG #Sustainability #Banking #ElectricVehicles #CommercialVehicles #GreenFinance #RiskManagement #ClimateRisk

0

Sustainability in Collateral Management – Manufacturing Assets

Sustainability in Collateral Management - Manufacturing Assets

In the first article of this series, we discussed the need to look beyond the conventional legal and financial characteristics of property collateral and progressively build a sustainability profile of the underlying asset.

Banks are indirectly involved in various manufacturing activities through funding; therefore, ascertaining sustainability aspects is critical when orienting their funds towards environment friendly activities. Evaluating sustainability in respect of manufacturing assets presents a significantly more complex challenge.

A manufacturing facility cannot be assessed only by asking whether the building is energy efficient, exposed to flooding, adequately insured or environmentally compliant.

The industrial activity taking place within that property can itself materially influence the sustainability and risk profile of the collateral.

A steel plant, pharmaceutical unit, automobile factory, textile processing facility and food-processing plant may all be classified broadly as manufacturing assets—but their environmental footprint, resource dependencies, regulatory requirements and transition risks can be substantially different.

From a banker’s perspective, this raises an important question:

How do we build a manufacturing sustainability assessment that is comprehensive without creating hundreds of different questionnaires?

A Layered Approach to Manufacturing ESG Assessment

In our view, the solution lies in a layered data architecture.

Instead of attempting to design one universal questionnaire—or a completely separate questionnaire for every industry—the assessment can be progressively constructed through four layers:

1. Common Manufacturing ESG Dataset: A baseline dataset applicable to manufacturing facilities irrespective of the industry.

2. Industry Group-Specific Dataset: Additional parameters based on the broad nature of the manufacturing activity—for example, metals, chemicals, automotive, textiles or food processing.

3. Industry / Activity-Specific Dataset: Specialised parameters relevant to the actual manufacturing process.

4. Site & Location-Specific Risk Dataset: Physical climate and environmental risks associated with the geographical location of the facility.

The resulting assessment can therefore be represented conceptually as:

Manufacturing ESG Assessment = Common Manufacturing Data + Industry-Specific Data + Activity-Specific Data + Site/Climate Risk

What Should the Common Manufacturing Dataset Cover?

Before getting into industry-specific requirements, Indian banks need a consistent baseline. The common manufacturing ESG dataset that we have been working on covers the following major areas:

The accompanying infographic provides an illustrative view of the data points that may be considered within these areas.

Article content

Why This Matters to a Banker

For banks, sustainability data should ultimately contribute to better risk understanding rather than becoming another compliance-oriented data collection exercise.

A structured manufacturing sustainability profile can potentially support:

• Identification of environmentally sensitive collateral

• Assessment of physical climate vulnerability

• Identification of energy-, water- and carbon-intensive assets

• Monitoring of environmental clearances and regulatory compliance

• Assessment of transition risk

• Identification of green or transition-finance opportunities

• Monitoring of climate-related insurance protection

• Portfolio concentration analysis across ESG-sensitive industries

• Identification of assets requiring enhanced monitoring

• Future assessment of sustainability implications for collateral value and marketability

Absolute Numbers Alone May Not Tell the Story

Manufacturing assessment also requires greater emphasis on intensity metrics.

A large manufacturing facility will naturally consume more electricity, water and other resources than a smaller facility.

Therefore, recording only absolute consumption may not provide a meaningful basis for comparison.

Where appropriate, the framework should also derive measures such as:

Energy Intensity = Energy Consumption / Production Output

Water Intensity = Water Consumption / Production Output

Carbon Intensity = GHG Emissions / Production Output

This enables comparison across facilities and, more importantly, monitoring of improvement or deterioration in the sustainability performance of the same asset over time.

Data Collection Should Not Mean Manual Data Entry

Another important consideration is the source of sustainability information.

Not every data point should be manually entered.

A mature collateral sustainability framework should progressively distinguish between:

• Customer / User Reported Data

• Document-Sourced Data

• Existing Bank / Collateral Data

• External API / GIS-Sourced Data

• System-Calculated Data

For example, production and energy-consumption information may come from the customer or supporting documents, while flood, cyclone, earthquake, heat stress or water-stress exposure can increasingly be obtained from external geospatial sources.

Carbon intensity, water intensity and composite risk indicators can then be system-calculated.

This approach can substantially improve both the reliability and operational feasibility of ESG data collection.

Entity ESG Risk and Asset Sustainability Risk Are Different

As discussed in Series 1, this distinction becomes even more important for manufacturing.

A manufacturing company may have a corporate ESG rating, but an individual plant offered as collateral can have its own sustainability characteristics.

The plant may be:

• located in a water-stressed region,

• dependent on carbon-intensive energy,

• exposed to flooding,

• operating under environmental clearances approaching expiry,

• generating hazardous waste, or

• operating with significantly better sustainability characteristics than the borrower’s other facilities.

Therefore:

Borrower ESG Profile ≠ Individual Manufacturing Asset Sustainability Profile

Banks may ultimately need visibility into both.

From Collateral Valuation to Collateral Resilience

Traditional collateral management asks:

What is the asset worth today?

A sustainability-enabled collateral framework introduces additional questions:

How environmentally sustainable is the asset?

How exposed is it to physical and transition risks?

Could these risks influence its future operations, insurability, marketability or value?

And perhaps most importantly:

How resilient is the collateral over the remaining life of the bank’s exposure?

This is where we believe sustainability can become an important additional dimension of modern collateral management.

The objective should not be to turn the collateral management system into a full-scale enterprise ESG platform.

Rather, it should ensure that sustainability characteristics capable of materially affecting collateral risk are identified, structured, monitored and made available to the bank’s wider risk-management ecosystem.

#CollateralManagement #ESG #Sustainability #Manufacturing #ClimateRisk #Banking #RiskManagement #GreenFinance #SustainableFinance #ClimateResilience

0

Real User Monitoring vs Synthetic Testing Guide

Your app runs smoothly on the office Wi-Fi. But what about the customer scrolling through it on a train, with patchy signal, on a three-year-old phone? Are they getting the same smooth experience — or are they giving up and closing the app? 

You won’t know the answer unless you’re monitoring the right way. That’s where two powerful tools come in: Real User Monitoring (RUM) and synthetic testing. Both help you track website performance and app performance, but they do it in very different ways. And most businesses need both — not just one. 

In this post, we’ll break down what each one does, how they’re different, and how to use them together to build a solid performance monitoring strategy. 

What Is Real User Monitoring (RUM)? 

Real User Monitoring, often just called RUM, tracks how actual visitors experience your website or app in real time. Every time someone opens your site, RUM quietly collects data in the background — page load speed, click response time, errors, device type, browser, location, and more. 

Think of it as a fitness tracker for your website. It doesn’t guess how things are going. It watches what’s really happening, second by second, for every single user. 

Why RUM matters: 

  • Shows real performance across different devices, browsers, and locations 
  • Captures issues that only happen for specific users (like slow load times only on iPhones, or only in certain countries) 
  • Helps you understand the actual user experience, not a simulated one 
  • Useful for spotting patterns tied to peak traffic hours 

What Is Synthetic Testing? 

Synthetic testing, sometimes called synthetic monitoring, works differently. Instead of watching real visitors, it uses automated scripts (bots) to simulate visits to your website at scheduled intervals — every 5 minutes, every hour, whatever you choose. 

These scripts test specific actions, like loading the homepage, adding an item to a cart, or logging in. Since the test conditions stay the same every time, it’s easy to compare results and catch problems early — even before a single real user shows up. 

Why synthetic testing matters: 

  • Works 24/7, even when your traffic is low or zero (like at 3 AM) 
  • Great for testing before a new feature or update goes live 
  • Helps with proactive uptime monitoring and catching downtime instantly 
  • Useful for testing critical user journeys (checkout, sign-up, login) on a consistent schedule 

RUM vs Synthetic Testing: The Key Differences 

Factor Real User Monitoring (RUM) Synthetic Testing 
Data source Real visitors Simulated bots/scripts 
Timing Continuous, live Scheduled intervals 
Best for Understanding actual user experience Catching issues before users do 
Needs traffic Yes No 
Consistency Varies by user/device Controlled and repeatable 

 
Neither one is “better.” They simply answer different questions. 

  • RUM answers: “How is my site actually performing for real people, right now?” 
  • Synthetic testing answers: “Is my site working the way it’s supposed to, all the time?” 

Why You Need Both (Not Just One) 

Relying only on synthetic testing means you might miss real-world problems — like a slow-loading page that only affects users in a specific region or on a specific browser. Your automated test might pass every time, but real customers could still be struggling. 

Relying only on RUM means you’re stuck waiting for real users to hit a problem before you know about it — including at 2 AM when nobody’s around to test manually. 

Together, they give you full-picture visibility: 

  1. Synthetic testing catches issues early, before launch, and monitors uptime around the clock. 
  1. RUM confirms how real users are actually experiencing your site after it goes live. 

This combined approach is often called a hybrid monitoring strategy, and it’s quickly becoming the standard for businesses serious about website performance and application reliability. 

How to Build a Simple Monitoring Strategy 

If you’re just getting started, here’s a simple approach: 

  1. Set up synthetic tests for your most important user journeys — homepage load, login, checkout, search. 
  1. Add RUM tracking across your site or app to capture real user data continuously. 
  1. Set alerts for both — so you know immediately if something breaks, whether it’s a scheduled test failing or a spike in real user errors. 
  1. Review the data regularly, not just when something goes wrong. Look for slow trends, not just outages. 
  1. Test across devices and regions, since performance can vary a lot depending on where and how people access your site. 

Frequently Asked Questions 

1. What is the main difference between RUM and synthetic testing?  
 
Real User Monitoring (RUM) tracks how actual visitors experience your website in real time. Synthetic testing uses automated scripts to simulate visits on a fixed schedule. RUM shows what’s really happening; synthetic testing checks that things are working as expected. 

2. Can I use only synthetic testing and skip RUM?  
 
You can, but you’ll miss real-world issues — like slow performance for users on a specific device, browser, or location. Synthetic tests only check the scenarios you’ve programmed, not everything a real visitor might run into. 

3. Is RUM enough on its own, without synthetic testing?  
 
Not really. RUM depends on having real traffic, so it won’t catch problems during low-traffic hours, and it can’t test something before it goes live. Synthetic testing fills that gap by running around the clock. 

4. Does RUM slow down my website? 
 
A well-implemented RUM script is lightweight and runs in the background, so the impact on load time is minimal. Most modern monitoring tools are built to be as unobtrusive as possible. 

5. How often should synthetic tests run?  
 
It depends on how critical the page or action is. Homepage and login checks might run every few minutes, while less critical pages can be checked hourly. Most teams start frequent and adjust based on results. 

6. Which one is better for SEO and Core Web Vitals?  
 
RUM is more useful here, since Google’s Core Web Vitals are based on real user data. Synthetic testing is still helpful for catching performance regressions early, before they affect real users and your rankings. 

7. Do small businesses need both, or is that overkill?  
 
Even small websites benefit from both. Synthetic testing can be set up cheaply for key pages, while basic RUM tools now come built into many analytics and hosting platforms. You don’t need an enterprise budget to start. 

Final Thoughts 

Website speed and reliability directly affect user experience, conversions, and search rankings. Choosing real user monitoring and synthetic testing isn’t really the right question — the real question is how to use both together, so you catch problems before they cost you customers and understand exactly what your real users are going through. 

At the end of the day, good website performance monitoring isn’t a one-time setup. It’s an ongoing habit — one that helps you build faster, more reliable websites and apps that people actually enjoy using. 

Need help setting up a performance monitoring strategy for your website or app? Get in touch to learn more. 

0

5 Fintech Trends from Global Fintech Fest 2026

5 Fintech Trends from Global Fintech Fest 2026

The Global Fintech Fest (GFF) 2026 — the world’s largest fintech gathering — is underway in Mumbai from September 8 to 11, bringing together policymakers, regulators, investors, and technology leaders from more than 80 countries. This year’s theme, “Potential to Impact: Agentic AI, Tokenisation, Quantum — Trusted, Connected, Global Systems for Inclusive Finance,” is a clear signal of where the industry is headed next. 

For leaders and product teams building fintech apps, GFF 2026 is not just a conference to watch from the sidelines — it’s a preview of the technology decisions you’ll be making over.  

Here are five themes from this year’s Global Fintech Fest, and what they actually mean for the product you’re building. 

1. Agentic AI Is Moving From “Chatbot” to “Co-Pilot” 

A major focus at GFF 2026 is agentic AI — systems that don’t just answer questions but take actions on a user’s behalf: initiating transfers, flagging fraud, negotiating terms, or managing a portfolio autonomously within set guardrails. 

The evolution of Ai from chatbot to co-pilot in banking and finance industry

If your roadmap still treats AI as a support widget bolted onto the UI, it’s time to rethink. The next generation of fintech apps will need AI woven into core workflows, with careful attention to permissions, auditability, and fail-safes — not just a chat window in the corner. 

2. Tokenisation Is Becoming Infrastructure, not a Feature 

Tokenisation — representing real-world assets, payments, credentials, or securities as digital tokens — was front and center in GFF 2026 discussions this year. It’s no longer a niche capability for crypto-native platforms; it’s becoming a baseline expectation for secure, composable financial systems. 

Tokenisation  - real-world assets, payments, credentials, or securities as digital tokens

Payment and asset-handling architecture needs to be built with tokenisation-readiness from day one. Retrofitting it later is expensive and risky. This affects everything from how you store sensitive data to how your APIs are designed to integrate with card networks, banks, and settlement layers. 

3. Quantum-Readiness Is No Longer a Far-Off Concern 

Quantum computing made it onto the main stage this year, with discussions focused on both its potential to transform financial modeling and the very real cybersecurity risk it poses to today’s encryption standards. 

Quantum computing in banking and finance industry 2026

You don’t need a quantum computer to start preparing. Forward-looking teams are already auditing their cryptographic standards and planning for “quantum-safe” migration paths — especially for apps handling long-lived sensitive data like KYC records or transaction histories. 

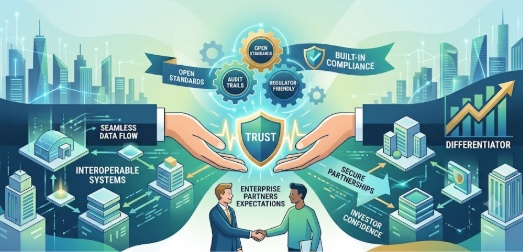
4. Trust and “Connected Systems” Are the New Differentiator 

A recurring thread across GFF sessions was the idea of trusted, connected, global systems — the notion that fintech’s next phase of growth depends less on flashy features and more on interoperability, transparency, and regulatory alignment across borders. 

Fintech's next phase -  trusted, connected, global systems financial systems

Compliance and interoperability can’t be an afterthought bolted on before launch. Building with open standards, clear audit trails, and regulator-friendly architecture from the start will save significant rework — and it’s increasingly what investors and enterprise partners expect to see. 

5. Inclusive Finance Is a Design Requirement, Not a CSR Line Item 

GFF 2026’s framing — “Potential to Impact” — emphasizes that emerging tech should produce measurable outcomes for everyday citizens and small businesses, not just enterprise clients. Financial inclusion was discussed as a design principle, not an afterthought. 

Accessibility, low-bandwidth performance, multilingual support, and simple onboarding flows aren’t nice-to-haves — they’re what separates fintech apps that scale across diverse markets from those that stay niche. 

Where This Leaves Product Teams 

Every trend coming out of GFF 2026 points to the same conclusion: the technical foundation of a fintech product matters more than ever. AI-driven features, tokenisation-ready payment rails, quantum-safe security, and inclusive design all need to be architectural decisions made early — not patches applied after launch. 

That’s exactly where we come in. 

At Fermion, we help fintech leaders and financial institutions design and build secure, scalable web and mobile platforms — from AI-powered features to payment infrastructure built for what’s next. If you’re planning a fintech product and want a technology partner who’s thinking about these shifts alongside you, let’s talk →[email protected]  

Sources: Global Fintech Fest 2026 official event materials and press coverage, September 2026. 

0

How to Optimize Interaction to Next Paint (INP): A Practical Guide for 2026

What Is Interaction to Next Paint
Core Web Vitals – Interaction to Next Paint (INP)

If your site scores well on Lighthouse but still feels laggy, the moment someone clicks a filter, opens a menu, or submits a form — you have an INP problem, not a load-time problem. 

Interaction to Next Paint (INP) became a Core Web Vital, replacing First Input Delay (FID). Unlike FID, which only measured the very first click on a page, INP measures how quickly a webpage responds to every user interaction throughout an entire visit. That distinction matters more than most teams realize: a site can post an excellent FID score and still feel broken the moment heavy JavaScript runs mid-session instead of at load. 

This guide covers what INP measures, why most existing INP content stops short of being useful, and the specific, framework-level fixes that bring real sites under the 200ms threshold — with code. 

What Is Interaction to Next Paint? 

Interaction to Next Paint measures how quickly a website responds to user interactions like clicks or key presses — specifically, how much time elapses between a user interaction and the next time the user sees a visual update on the page. It captures clicks, taps, and keyboard input across the entire session, not just the first one. 

A good INP score is 200 milliseconds or less at the 75th percentile. Google scores your site using the CrUX (Chrome User Experience Report) field data collected from real visitors, not a synthetic lab test — so INP reflects what actual users on actual devices experience. 

INP Value Rating 
0–200ms Good 
200–500ms Needs Improvement 
500ms+ Poor 

Despite two years of attention, this metric is still the industry’s biggest blind spot. Roughly 40% of origins on mobile still fail to meet INP thresholds heading into 2026, making it a persistent liability for search rankings and user experience alike. 

The Three Phases of an Interaction 

Every user interaction that INP measures is made up of three phases, and knowing which one is broken tells you exactly which fix to reach for. 

  1. Input delay — the time between the user’s action and the browser starting to process it. Usually caused by the main thread already being busy with another task. 
  1. Processing duration — the actual work your event handler, framework, and re-renders do in response to the interaction. 
  1. Presentation delay — the time it takes the browser to paint the visual result to the screen once processing is done. 

INP reports the longest of these full interactions observed during a session, so fixing your average case isn’t enough — you have to eliminate the outliers. 

Why INP Is Hard to Fix (and Why It’s Worth Fixing) 

INP is a frontend queueing problem in disguise. Think of the main thread like a single-lane road: when a large task — a 10,000-row filter, a heavy re-render, a synchronous JSON parse — is running, every user interaction has to wait in line behind it before the browser can even start responding. 

The business cost is measurable, not theoretical. Improving INP from 500ms to 200ms correlates with a 22% improvement in user engagement metrics including time on page and return visits, and a widely cited INP case study on web.dev found a 7% sales lift after a company implemented responsiveness improvements tied to INP. For a checkout flow, a lead-gen form, or a SaaS dashboard, every sluggish click is a small tax on conversion. 

How to Measure INP (Before You Touch Any Code) 

Don’t optimize blind. Start with field data, then move to lab tools to reproduce and debug: 

  • Chrome UX Report (CrUX) / PageSpeed Insights — real-user field data at the URL and origin level. 
     
  • Search Console → Core Web Vitals report — flags which page groups are failing INP in production. 
     
  • web-vitals JS library — drop it into your app to log real INP scores per session, segmented by device or route. 
     
  • Chrome DevTools Performance panel — record a session, reproduce the slow interaction, and inspect the flame chart. 
     
  • Long Animation Frames (LoAF) API — pinpoints exactly which script or function is responsible for a slow frame, which is far more actionable than a generic “long task” warning. 

Fix based on the interaction that’s actually failing in the field, not the one that’s easiest to reproduce locally. 

Fixing Input Delay 

Input delay usually means the main thread is tied up before the click even registers. 

  • Code-split and lazy-load non-critical JavaScript so it isn’t competing with interaction handling. 
     
  • Defer or async non-essential third-party scripts (chat widgets, analytics, ad tags) — audit these first, they’re a common hidden culprit. 
     
  • Break up long tasks at their source using scheduler.yield(), which pauses execution to let the browser handle pending high-priority work, then resumes where it left off: 
     

async function yieldToMain() { 
  if (‘scheduler’ in window && ‘yield’ in window.scheduler) { 
    return await window.scheduler.yield(); 
  } 
  return new Promise((resolve) => setTimeout(resolve, 0)); 
} 
 
async function processLargeDataset(items) { 
  for (let i = 0; i < items.length; i++) { 
    processItem(items[i]); 
    if (i % 50 === 0) await yieldToMain(); // give the main thread breathing room 
  } 
} 
 

This single fix — breaking long tasks into smaller chunks with scheduler.yield() — is often the highest-leverage change you can make, since it directly reduces the wait time for every pending interaction. Note browser support: Chrome and Edge support it from version 129, Firefox from 142, and Safari does not yet support it — always ship the setTimeout fallback shown above. 

Fixing Processing Duration 

This is where most of the real engineering work lives. 

  • Debounce, don’t just throttle, expensive input handlers. Throttling still recalculates on an interval while the user types or scrolls; debouncing waits until they stop, which is usually the better trade-off for search and filter inputs. One team found that replacing a throttled scroll handler with a debounced one produced a noticeably smoother result because the calculation only ran once activity settled. 
     
  • Move heavy computation off the main thread with Web Workers — JSON parsing, sorting large datasets, or client-side filtering are good candidates. 
     
  • Virtualize long lists and tables so you’re only rendering what’s visible, not re-rendering thousands of DOM nodes on every keystroke. 
     
  • Avoid layout thrashing — batch DOM reads and writes instead of interleaving them, which forces the browser into repeated synchronous reflows. 

For a search filter over a large table, a typical fix chain looks like: debounce the input, paginate or virtualize the results, and render only the visible rows instead of re-rendering the full table on every keystroke. 

Framework-specific notes 

React: memoization, debouncing, concurrent rendering features, and virtualization are the techniques that most directly move the INP needle. React 18’s concurrent rendering yields back to the main thread roughly every 5ms during rendering to check for higher-priority work like user input, so upgrading rendering strategy alone can meaningfully help — but it isn’t a substitute for fixing genuinely long synchronous handlers. 

Vue / Angular / vanilla stacks: the same principles apply — the framework name changes; the fix doesn’t. Identify the long task with the Performance panel or LoAF, then split, defer, or move it off-thread. 

Fixing Presentation Delay 

Once processing finishes, the browser still has to paint. Reduce this by: 

  • Simplifying complex CSS selectors and reducing DOM depth in the area being updated. 
     
  • Avoiding non-composited animations (animate transform/opacity instead of properties that trigger layout). 
     
  • Giving users instant visual feedback (a pressed state, a spinner, a skeleton) — this doesn’t reduce the technical INP number by itself, but it’s good practice alongside the real fix, since perceived responsiveness matters for user trust even while you’re shipping the underlying fix. 

The Prioritized INP Checklist 

Work through these roughly in order of impact per hour of engineering time: 

  1. Audit and defer/async third-party scripts. 
  1. Find your top 3 slowest interactions in CrUX/Search Console field data. 
  1. Reproduce each in DevTools and identify the responsible script via the LoAF API. 
  1. Break up the long task with scheduler.yield() (with fallback). 
  1. Debounce expensive input handlers; replace throttling where appropriate. 
  1. Virtualize large lists/tables; paginate where virtualization isn’t feasible. 
  1. Move CPU-heavy work (parsing, sorting, filtering) to a Web Worker. 
  1. Re-measure with field data — lab data alone won’t confirm the fix. 

FAQ 

Is INP a ranking factor?  
 
Yes — INP is one of Google’s three Core Web Vitals that impact search result rankings, alongside Largest Contentful Paint and Cumulative Layout Shift. 

Can I test INP without real users?  
 
Not directly — INP relies on real user interactions and is primarily measured through field data, since it requires an actual interaction to occur, though you can script interactions in a lab environment to approximate it. 

What replaced FID, and when?  
 
INP replaced First Input Delay as a Core Web Vital in March 2024. 

The Bottom Line 

INP rewards continuous engineering discipline, not a one-time fix. You can’t optimize only the initial page load and call it done — every interaction throughout the session counts toward your score. Teams that treat responsiveness as an ongoing budget, not a launch checklist, are the ones that stay under 200ms as their product grows. 

If your team doesn’t have the bandwidth to profile long tasks, restructure rendering, and re-test against field data on an ongoing basis, that’s exactly the kind of performance engineering work we take on for clients — get in touch and we’ll audit your site’s real INP data before you spend a single engineering hour guessing. 

0

Sustainability in Collateral Management — Series 1

For decades, banks have assessed property collateral primarily through a familiar set of parameters—ownership, title, valuation, location, marketability, legal enforceability and insurance.

But the risk environment surrounding physical assets is changing.

A property may have a strong market value today, but its long-term value, marketability, insurability and resilience could increasingly be influenced by environmental and climate-related factors.

Consider a few questions:

  • Is the property exposed to flooding?
  • Is it located in an area vulnerable to cyclones, earthquakes, wildfires or rising sea levels?
  • How energy-efficient is the building?
  • Does it have a recognised green-building certification?
  • Could environmental litigation or regulatory non-compliance affect its value?
  • Is adequate insurance available against material climate events?

These questions suggest that collateral management may need to evolve beyond maintaining a static financial and legal description of an asset.

Building a Sustainability Profile of Your Collateral

For properties and physical assets, we believe a structured ESG assessment should consider data across five broad dimensions:

  1. Environmental Attributes
  2. Climate Risk
  3. Social Parameters
  4. Governance Parameters
  5. Financial Sustainability

The accompanying infographic provides an illustrative framework of the data points that banks may consider capturing under these dimensions.

A structured sustainability dataset can potentially help banks develop capabilities for:

  • Climate vulnerability assessment
  • ESG risk profiling
  • Green asset identification
  • Sustainability-linked financing assessment
  • Climate insurance monitoring
  • Portfolio-level sustainability analytics
  • Identification of collateral exposed to emerging environmental and climate risks

Borrower ESG Risk and Collateral Sustainability Risk Are Not the Same

An important distinction needs to be made between Borrower ESG Risk and Collateral Sustainability Risk.

A borrower may have a strong corporate ESG profile, while a particular property offered as collateral may still be located in a high flood-risk zone, have poor energy efficiency or face other environmental vulnerabilities.

Conversely, an individual asset may have strong sustainability characteristics even when the broader ESG profile of the borrower requires improvement.

Therefore, the sustainability profile of collateral deserves to be assessed as a distinct—but interconnected—dimension of enterprise risk and collateral management.

The Question for Banks Is Changing

As banks progressively strengthen their ESG and climate-risk frameworks, the question may no longer be only:

“What is the current value of my collateral?”

It may increasingly become:

“How sustainable and climate-resilient is my collateral—and what could that mean for its value over the life of the exposure?”

This is the first article in my series on Sustainability in Collateral Management.

In the next article, we will discuss the significantly more complex challenge of ESG assessment of manufacturing and industrial assets, including how a common manufacturing ESG dataset can be supplemented with industry-specific sustainability parameters.

#CollateralManagement #ESG #Sustainability #ClimateRisk #Banking #RiskManagement #GreenFinance #SustainableFinance

0

Page Speed and Core Web Vitals

Core web vitals
What page speed and Core Web Vitals actually are, why they matter far more than most companies realize, and what a slow site is quietly costing you.

Your site loads in 4 seconds. That doesn’t sound bad — until you realize you just lost roughly a quarter of your visitors before they saw a single word of your homepage. 

“Speed matters” has been repeated so often it’s become elevator music — technically true, completely ignored. Most teams still file page speed under “the dev team will get to it eventually,” somewhere between rebranding the favicon and fixing that one broken footer link. 

Here’s the problem with that thinking: a slow website isn’t a technical footnote. It’s a leak — quietly draining revenue, marketing spends, and customer trust, all disguised as one boring-looking metric that never makes it into the board meeting. 

Let’s break down what page speed and Core Web Vitals actually are, why they matter far more than most companies realize, and what a slow site is quietly costing you. 

What Are Core Web Vitals, Actually? 

Core Web Vitals are a set of metrics Google uses to measure real-world user experience on a webpage. There are three that matter most: 

Largest Contentful Paint (LCP) — How long it takes for the main content of a page (usually a hero image, headline, or key visual) to load. Google considers anything under 2.5 seconds “good.” 

Interaction to Next Paint (INP) — How responsive your site feels when someone actually clicks, taps, or types. This replaced First Input Delay in 2024 and measures the full lifecycle of an interaction, not just the first one. Under 200 milliseconds is the target. 

Cumulative Layout Shift (CLS) — How much your page visually jumps around while loading. Ever tried to tap a button and had an ad load in at the last second, causing you to misclick? That’s a CLS failure. Under 0.1 is considered good. 

These aren’t arbitrary numbers Google invented for fun. They’re built from research on how real users perceive speed, frustration, and trust — and they directly correlate with whether someone stays on your site or bounces. 

The Business Cost Nobody’s Tracking 

Here’s the part that should get a CFO’s attention: page speed problems show up on the balance sheet, they just don’t get labeled that way. 

Conversion rate drops fast. Research from Google and various e-commerce studies consistently shows conversion rate decay as load time increases — often in the range of a 20% drop as page load time goes from 1 to 3 seconds, with steeper drops beyond that. If your checkout flow has a sluggish INP score, people abandon carts not because they changed their mind, but because the button felt broken. 

SEO rankings take a hit. Core Web Vitals are a confirmed Google ranking signal. Two sites with similar content and backlink profiles can rank differently based purely on experience metrics. If competitors are faster, they get the click — and the compounding organic traffic that comes with it. 

Paid ad spend gets wasted. If you’re running Google Ads or Meta campaigns, a slow landing page means you’re paying full price per click and then losing a chunk of those visitors before the page even finishes loading. Slow pages also hurt Quality Score, which raises your cost-per-click. You’re paying more to convert less. 

Brand trust erodes quietly. Users don’t consciously think “this site has a 4.2 second LCP.” They think “this feels cheap” or “this feels broken,” and they leave. That perception transfers to how they judge your product or service, even if the two have nothing to do with each other. 

Mobile users suffer most. Over half of global web traffic is mobile, often on inconsistent networks. A site that feels fine on a developer’s fiber connection can be nearly unusable on a mid-range phone with spotty 4G. That gap is where a huge percentage of lost conversions live. 

Why This Gets Overlooked 

Speed problems are easy to ignore because they’re invisible in most reporting dashboards. Traffic numbers look fine. Ad spend looks normal. But bounce rate, cart abandonment, and “visitors who never made it past the homepage” quietly absorb the damage. Nobody connects a 30% higher bounce rate on mobile to a 1.2 CLS score, because most marketing and business teams have never been shown the connection. 

This is also why speed tends to degrade over time even on well-built sites. A marketing team adds a chat widget. Then a personalization script. Then three more tracking pixels and an A/B testing tool. Each addition seems harmless individually, but together they slowly strangle load time — a phenomenon developers call “JavaScript bloat” or “death by a thousand scripts.” 

What Actually Moves the Needle 

Fixing page speed isn’t about chasing a perfect Lighthouse score for its own sake. It’s about targeted engineering work that removes real friction for real users: 

  • Image and media optimization — modern formats (WebP/AVIF), proper sizing, and lazy loading for anything below the fold 
     
  • Reducing and deferring JavaScript — auditing third-party scripts and only loading what’s actually needed, when it’s needed 
     
  • Server response time (TTFB) — better hosting, caching layers, and CDN configuration so the very first byte arrives faster 
     
  • Reserving layout space — explicit dimensions for images, ads, and embeds so nothing shifts once it loads 
     
  • Code splitting and critical CSS — loading only what’s needed to render the visible screen first, deferring the rest 
     
  • Font loading strategy — avoiding render-blocking web fonts that delay text from appearing 

None of these are one-time fixes. Speed is a maintenance discipline, not a project with an end date — which is exactly why it needs to be baked into how a site or app is built from day one, not bolted on afterward. 

Speed Is a Design Decision, Not Just a Dev Task 

The teams that get this right treat performance as a product requirement alongside design and functionality — not a QA checklist item at the end. That means: 

  • Setting performance budgets before development starts (e.g., “homepage LCP must stay under 2 seconds”) 
     
  • Reviewing the impact of every new feature, script, or integration on load time before shipping 
     
  • Testing on real mid-tier devices and throttled networks, not just fast office Wi-Fi 
     
  • Monitoring Core Web Vitals continuously in production, not just during a pre-launch audit 

This is also where the build approach matters. A site or app architected with performance in mind from the start — smart component structure, minimal dependency bloat, proper caching strategy — will always outperform one where speed is retrofitted after the fact. 

The Bottom Line 

A slow site is not just a minor inconvenience — it’s a leak in the funnel that touches SEO, ad performance, conversion rate, and brand perception all at once. And because the damage is spread across so many metrics, it rarely gets the attention it deserves until a competitor faster site starts winning the customers you should have kept. 

If your site or app hasn’t had a real performance audit recently, that’s usually the fastest, highest-leverage place to start — often surfacing bigger wins than a redesign or a new marketing campaign would. 

2

Server Components Explained: What Changes for Developers in 2026

Server Components Explained: What Changes for Developers in 2026
What Server Components mean for the modern developer workflow in 2026

For most of the last decade, React development meant one thing: ship your component tree to the browser, let it hydrate, and manage everything client-side. React Server Components (RSC) break that assumption. What started as an experimental idea in 2023 has, by 2026, become the default architecture for new React applications — and it changes not just how apps perform, but how developers think about writing them in the first place. 

This post breaks down what Server Components are, what’s changed in 2026, and what it means for your day-to-day workflow. 

What Are Server Components? 

A Server Component is a component that renders exclusively on the server. It never ships to the browser as JavaScript — only its rendered output does. That’s a meaningfully different model from traditional Server-Side Rendering (SSR), where the server renders an initial HTML payload, but the client still downloads and hydrates the entire component tree afterward. 

With RSC, a component that only fetches and displays data contributes zero bytes to the client bundle. No hydration, no JavaScript execution, no client-side re-render. It also means these components can do things client components never could — query a database directly, read from the filesystem, or use API keys and secrets without exposing them, all without hand-rolling a separate API layer. 

Client Components still exist for anything interactive — forms, buttons, state, effects — but they’re now the exception you opt into with a “use client” directive, rather than the default you start from. 

What’s Different in 2026 

A few things have shifted since RSC was first introduced: 

It’s no longer experimental. Frameworks have moved RSC from an opt-in feature to the default rendering model. Server-first is now simply how a new app is structured, not a special mode you turn on. 

The ecosystem has caught up. Early RSC adoption was rough because popular libraries — state managers, data-fetching tools, styling solutions — weren’t built with a server/client boundary in mind. That’s largely resolved now. Data-fetching libraries offer native RSC support, and styling approaches like Tailwind CSS and CSS Modules have become the practical default because they work with Server Components without extra configuration. 

Patterns have stabilized. The chaotic “everyone’s figuring this out live” phase is over. Teams have converged on a workable division of labor: Server Components handle the initial data load, client-side data libraries handle subsequent fetching and caching, and lightweight state managers handle ephemeral UI state like modals or cart contents. Real-time features (WebSockets, live updates) remain client-side, since server push still needs a persistent client connection. 

More frameworks support it. RSC is no longer a Next.js-only story. Other frameworks have built their own implementations, which means the underlying mental model — not just the Next.js API surface — is now a portable skill. 

What Actually Changes for Developers 

1. Your default mental model flips. Instead of asking “how do I fetch this data client-side,” the default question becomes “does this need to be interactive at all?” If not, it stays on the server. You opt into client-side JavaScript deliberately, rather than by default. 

2. Data fetching gets simpler — and stricter. You can fetch data directly inside an async Server Component with no useEffect, no loading state boilerplate, and no client-visible API endpoint. The tradeoff: everything crossing the server/client boundary must be serializable. Functions, class instances, and non-serializable objects can’t simply be passed down as props anymore, which introduces a new category of bugs teams need to learn to spot. 

3. Bundle size becomes a design decision, not an afterthought. Because Server Components ship no JavaScript, overall client bundle size drops substantially in typical applications — often by well over half, according to teams tracking the impact on production apps. That translates directly into faster load times and better Core Web Vitals scores, particularly Largest Contentful Paint and Interaction to Next Paint, both of which affect user experience and SEO. 

4. The server/client boundary is the new thing to get right. Most production issues with RSC don’t come from Server Components themselves — they come from misunderstanding where that boundary sits. Common mistakes include reaching for useState or useEffect inside a Server Component (they only run in the browser and simply won’t work there) or over-fetching in a way that doesn’t take advantage of streaming. 

5. Migration is incremental, not all-or-nothing. The practical recommendation from teams already running this in production: don’t rewrite an entire application at once. Start with isolated, data-heavy pages, convert those to Server Components, and expand as your team builds intuition for where the boundary should sit. Codebases that try to convert everything immediately tend to spend weeks debugging serialization and caching issues that smaller, deliberate migrations avoid. 

Is It Right for Every App? 

Not necessarily — and it’s worth being honest about that. RSC’s benefits are largest for content-heavy, data-driven applications: dashboards, marketplaces, publishing platforms, anything where most of the page is server-rendered content with pockets of interactivity. For apps that are almost entirely interactive — real-time editors, games, highly dynamic single-page tools — the benefits are smaller, and some teams have found lighter client-side frameworks give a better experience for that specific use case. As with any architectural shift, the right call depends on what your application actually needs to do, not just where the industry trend is pointing. 

The Bottom Line 

Server Components represent the biggest shift in how React applications are structured since the introduction of Hooks. The core idea is simple — keep as much as possible on the server, push interactivity to the client only where it’s genuinely needed — but the implications run through data fetching, bundle size, debugging, and how teams design new features. 

For developers building on modern React frameworks in 2026, understanding the server/client boundary isn’t an optional deep cut anymore. It’s foundational knowledge that everything else in the framework is now built on top of. 


0

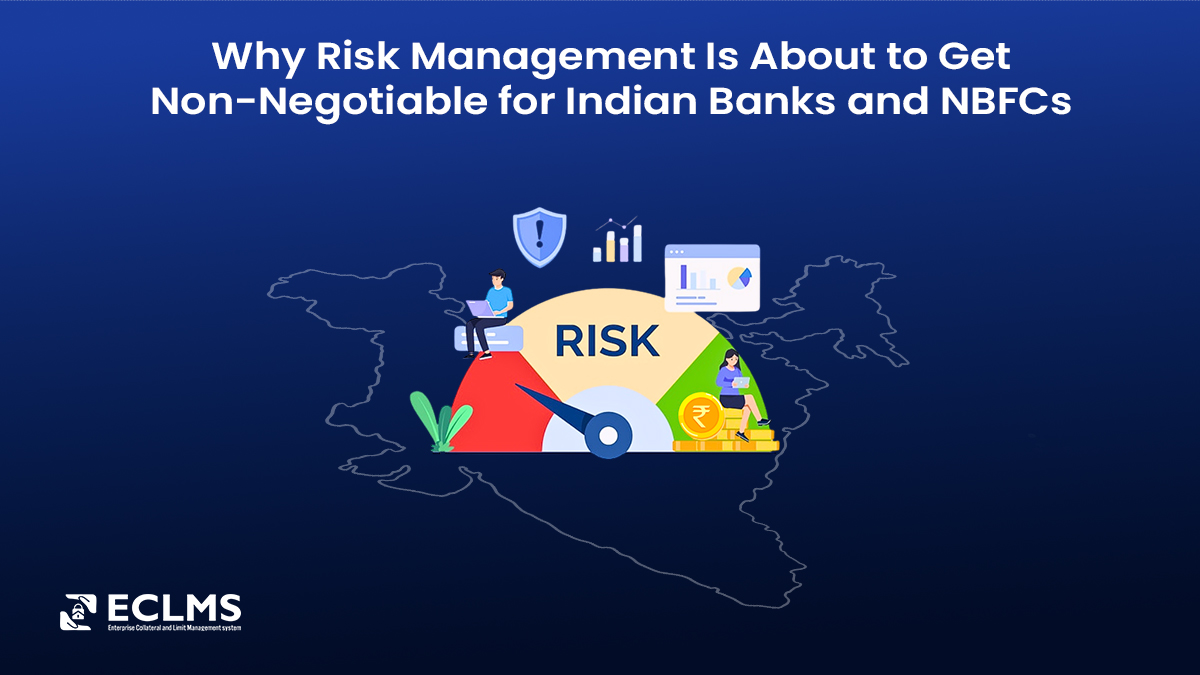
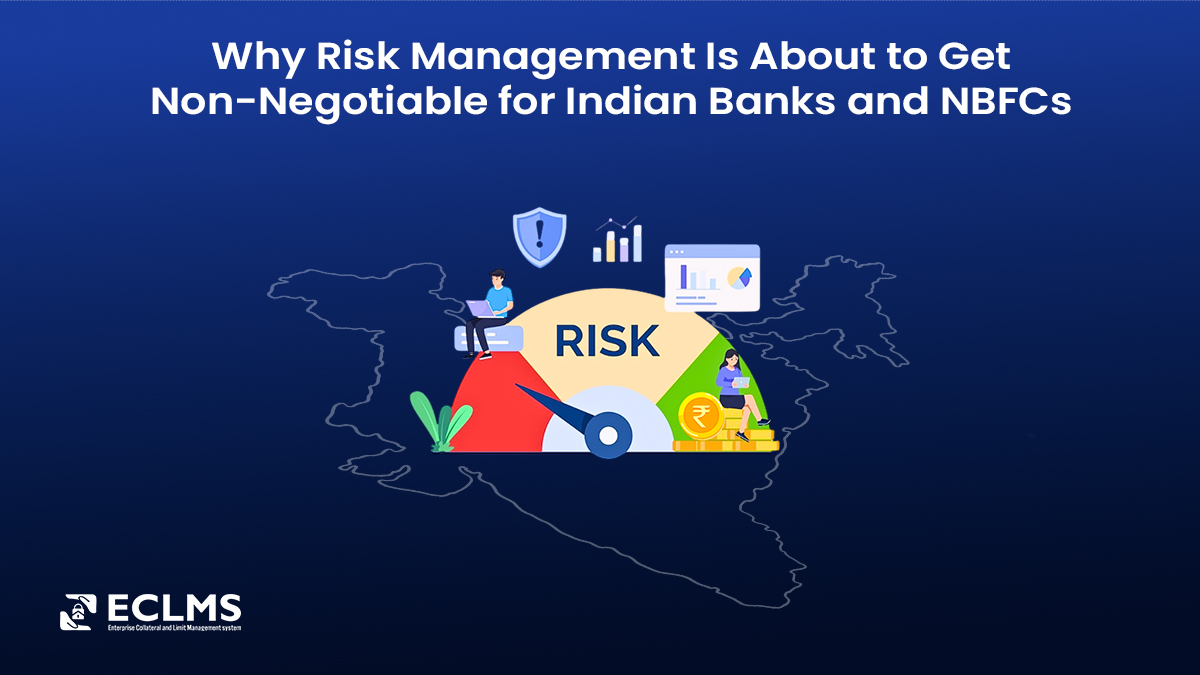
Why Risk Management Is About to Get Non-Negotiable for Indian Banks and NBFCs

Risk Management in Indian Banks and NBFC's
Risk  management for Indian banks and NBFC's

Indian financial institutions are entering the most consequential regulatory reset since the 1990s prudential norms — and most risk teams are not ready for what’s coming. 

In April 2026, the RBI issued its final directions on Expected Credit Loss (ECL) provisioning for Scheduled Commercial Banks, replacing the decades-old incurred-loss, overdue-ageing model with a forward-looking, IFRS 9-aligned framework. Banks now have until April 1, 2027 to implement it, with a glide path to absorb the capital impact stretching out to 2031. NBFCs and large corporates have already been living under this regime — via Ind AS 109 — for years. Banks are the last major regulated entities left to make the jump, and the runway is tight. 

Layer on top of that RBI’s Large Exposures Framework, which caps a bank’s exposure to any single counterparty at 20% of Tier 1 capital (25% for a group of connected counterparties), with any breach requiring board-level sign-off and mandatory rectification within 30 days. And add tightened intragroup exposure norms for foreign bank branches effective April 2026. The message from the regulator is consistent: institutions need real-time, defensible visibility into exposure and collateral — not quarter-end reconciliation. 

Why This Is Personal for Indian Risk Teams 

India doesn’t need to import case studies to make the point. The IL&FS collapse in 2018 and the DHFL crisis that followed were, at their core, concentration and collateral failures — infrastructure and housing finance exposures that looked diversified on paper but were opaque, interconnected, and poorly collateralized in reality. Both triggered contagion through the NBFC sector and mutual fund holdings, and both are still cited by regulators and rating agencies as the reason India’s large exposure and provisioning norms exist in their current form. 

That history is exactly why the ECL shift matters more here than almost anywhere else. A model built on forward-looking probability of default, loss given default, and exposure at default would have flagged IL&FS-style deterioration long before the overdue-ageing model did. The RBI’s own framing is unambiguous: banks have effectively been fighting fires after the house burns down; ECL asks them to price the fire risk before it starts. 

What This Means Operationally 

For risk and credit teams at Indian banks, NBFCs, trade finance houses, and commodity trading desks, the next 18 months mean building — or buying — the infrastructure to support: 

  • Counterparty and group-level limit monitoring mapped directly to LEF thresholds (20%/25% of Tier 1 capital), with automated alerts well before a breach, not a scramble to explain one to the RBI within the 30-day window 
     
  • PD/LGD/EAD modelling with a minimum of five years of clean historical data — a genuine problem for institutions still running fragmented, spreadsheet-based exposure records 
     
  • Board-level governance and model validation frameworks, since RBI’s final directions explicitly require model inventories and structured oversight, not just a provisioning number 
     
  • Real-time collateral valuation integrated with exposure data, because Stage 1/Stage 2 classification under ECL depends on early signs of credit deterioration that static, quarterly collateral marks will simply miss 
     
  • MSME-specific monitoring, since RBI’s own commentary flags MSMEs and smaller borrowers as the segment where ECL implementation will require the closest watching — thinner credit histories make PD estimation harder and provisioning swings sharper 

The Two-Tier Problem Nobody’s Talking About Yet 

One detail getting less attention than it deserves: RBI’s ECL directions exclude Regional Rural Banks, Small Finance Banks, and Payments Banks — for now. That creates a two-tier system where the largest, most sophisticated players move to forward-looking risk models while smaller, often more vulnerable institutions stay on the old ageing-based approach. Anyone building a limit and collateral management strategy right now should be building for eventual convergence, not just the April 2027 deadline in front of them. 

Bringing Limits and Collateral Onto One Platform 

None of this is achievable through disconnected spreadsheets and manual reconciliation — not at the data granularity RBI is now asking for. Institutions that centralise exposure, limits, and collateral data onto a single, real-time platform get: 

  • A single view of counterparty and group exposure, mapped directly to LEF limits 
  • Automated breach alerts that give teams the runway to act inside the 30-day rectification window 
  • Audit trails and model governance documentation built for RBI’s board-oversight and validation requirements, not retrofitted after the fact 
  • API-based integration with existing core banking and treasury systems, avoiding a rip-and-replace implementation during an already tight regulatory runway 

The Bottom Line 

The ECL transition, the tightened Large Exposures Framework, and the lessons of IL&FS and DHFL all point to the same conclusion: limit management and collateral management are no longer back-office housekeeping in India. They are the mechanism that determines whether an institution meets RBI’s April 2027 deadline with confidence or scrambles through it. 

If your institution is mapping out its ECL and LEF readiness, our team can walk you through how an enterprise-grade limit and collateral management platform fits into that roadmap — with minimal disruption to your existing core systems. 

Get in touch to schedule a walkthrough built specifically around India’s evolving risk and provisioning landscape. 

0

How to Prioritize Features for MVP Development in 2026

App features to priorities before building MVP

When we start building a fintech product, we usually make a huge wish list: budgeting tools, instant payments, fraud detection, robo-advisory, crypto wallets, loyalty rewards — and more. The temptation is to build all of it at once so the product feels “complete” from day one. 

But that’s one of the fastest ways to burn through your funding without ever launching something people actually use. 

An MVP isn’t a weaker, half-finished version of your big vision. It’s a focused product that does one thing really well, proves people want it, and gives you real feedback to plan what’s next. And in fintech — where trust, security, and compliance aren’t optional — deciding which features to build first isn’t just a product decision. It’s a way of managing risk. 

Here’s how to think through it before your development team writes a single line of code. 

Why Feature Prioritization Matters More in Fintech 

Unlike a lifestyle app where a missing feature just means a mediocre review, fintech products carry regulatory, security, and financial risk with every feature you add. Each new capability — a new payment rail, a new data integration, a new user role — expands your compliance surface (KYC/AML obligations, PCI DSS scope, data residency rules) and your attack surface. 

This means the cost of building the wrong feature first isn’t just wasted engineering time. It’s: 

  • Delayed regulatory approval or licensing 
  • Increased audit and compliance overhead 
  • A larger codebase to secure and maintain 
  • Slower time-to-market against competitors 
     

Prioritization, done well, keeps your MVP lean enough to launch quickly and defensible enough to pass scrutiny from regulators, banking partners, and security-conscious users. 

Step 1: Define the One Problem Your MVP Must Solve 

Before evaluating features, get ruthlessly specific about the core problem. “We’re building a personal finance app” is not specific enough. “We help gig workers smooth irregular income with automated micro-savings” is. 

Ask your team: 

  • What single outcome must a user achieve to consider this product a success? 
  • What would make someone choose this over their bank’s existing app or a spreadsheet? 
  •  

Every feature you’re considering should be tested against this single problem statement. If it doesn’t directly serve it, it’s a candidate for a later release, not the MVP. 

Step 2: Separate “Must-Have” Infrastructure from “Nice-to-Have” Functionality 

In fintech, some features aren’t optional even in an MVP, because they’re the price of entry for handling money at all: 

Non-negotiable foundations: 

  • Secure user authentication and identity verification (KYC) 
  • Encrypted data storage and transmission 
  • Basic transaction logging and audit trails 
  • Compliance with relevant regulations (e.g., PCI DSS, GDPR, PSD2, or local equivalents) 
  • Core ledger accuracy — money in, money out, always reconciled 

Genuinely deferrable functionality: 

  • Advanced analytics dashboards 
  • Gamification and rewards 
  • Multi-currency support beyond your initial market 
  • Social or referral features 
  • AI-driven personalization 

A common mistake is treating compliance and security as “backend details” to bolt on later. In fintech, they’re part of the MVP’s core value proposition — users and partners won’t trust a product without them, regardless of how polished the UI is. 

Step 3: Use a Structured Framework, Not Gut Feel 

Once you have a candidate feature list, run it through a scoring framework so decisions aren’t driven by whoever argues loudest in the roadmap meeting. 

RICE scoring (Reach, Impact, Confidence, Effort) works well for fintech because it forces you to weigh engineering and compliance effort against actual user impact — a feature that touches payment processing will have a very different effort score than a UI tweak. 

MoSCoW method (Must-have, Should-have, Could-have, Won’t-have) is useful for stakeholder alignment, especially when investors, compliance officers, and engineers all have different opinions about what’s “essential.” 

Kano model helps distinguish between features that satisfy basic expectations (a working transfer function), features that scale satisfaction linearly (faster processing times), and features that delight (instant categorized spending insights). MVPs should nail the first category before touching the third. 

Whichever framework you choose, the goal is the same: create a shared, defensible rationale for what’s in and what’s out. 

Step 4: Validate Assumptions Before Committing Engineering Time 

Talk to potential users and, if applicable, banking or payment partners before finalizing your roadmap. A few low-cost validation methods: 

  • Clickable prototypes to test whether users understand and want the core flow 
  • Concierge MVPs, where a manual or semi-automated process stands in for a feature to test demand before building it 
  • Landing page tests measuring signup interest for specific capabilities 
  • Partner conversations with banks, card issuers, or payment processors to confirm technical and compliance feasibility early — this can save months of rework later 
     

Fintech products often depend on third-party integrations (core banking systems, card networks, KYC providers). Validating these dependencies early prevents a scenario where your MVP is feature-complete but blocked by an integration that takes three months to approve. 

Step 5: Design for Extension, Not Just Reduction 

Prioritization isn’t about permanently cutting features — it’s about sequencing them. Your MVP architecture should make it straightforward to add the deferred features later without a rebuild. 

Practical ways to do this: 

  • Build a modular architecture with clear service boundaries (e.g., separate services for identity, ledger, and notifications) 
  • Use API-first design so new features can be added as additional endpoints rather than reworking the core 
  • Choose infrastructure and compliance frameworks that scale with you (cloud providers with strong fintech compliance support, tokenization for sensitive data) rather than solutions that will need replacing at scale 
     

This is where working with a development partner experienced in fintech pays off — the difference between an MVP that scales smoothly and one that requires a costly rebuild often comes down to these early architectural decisions. 
 

Step 6: Define What Success Looks Like Before You Launch 

Every step so far has been about deciding what to build. This one is about deciding, in advance, how you’ll know if it worked — because “we launched” is not the same as “we validated.” 

Too many fintech teams ship an MVP, watch signups trickle in, and call it a win without ever defining what a win was supposed to look like. Set your thresholds before launch, not after, so you’re not tempted to retrofit a good story onto mediocre numbers. 

At minimum, define targets in three categories: 

Activation metrics — did users get through the door? 

  • % of signups completing KYC 
  • % of verified users completing their first core action (first transfer, first micro-save, first budget set) 

A high drop-off here usually means friction, not lack of interest — and it’s the first place to look before concluding the idea doesn’t work. 

Core-loop metrics — is the product actually solving the problem? 

  • Whatever number ties directly back to your Step 1 problem statement. If your MVP promises to smooth irregular income, that’s savings frequency or balance stability over time — not app opens or session length. 

Compliance and ops health — is it working without quietly creating risk? 

  • KYC failure/false-reject rate 
  • Reconciliation discrepancies 
  • Fraud or AML flags per transaction volume 

A fintech MVP that’s growing but failing quietly on this front isn’t validated — it’s a liability waiting to surface at your next audit or funding round. 

Finally, agree on a decision threshold before you launch: what number, hit or missed by what date, triggers “build more,” “pivot the core assumption,” or “shut it down.” Without this, MVPs have a way of becoming permanent — a product that never quite fails but never quite proves itself either, quietly consuming runway in the meantime. 

A Simple Prioritization Checklist 

Before locking your MVP scope, run through this: 

  1. Does this feature directly serve the one core problem we’re solving? 
  1. Is this feature a compliance or security requirement, not a preference? 
  1. Have we validated real user demand for this, beyond internal opinion? 
  1. What is the actual engineering and compliance effort required? 
  1. Can this be added later without re-architecting the product? 
  1. If we removed this feature entirely, would the MVP still deliver its core value? 
     

If a feature fails for most of these checks, it belongs on your roadmap — not your launch list. 

Final Thoughts  

The strongest and top fintech products aren’t the ones that launch with the most features — they’re the ones that launch with the right features, built on a foundation that can grow. Prioritization is what separates an MVP that earns early trust and real usage data from one that becomes a maintenance burden before it ever finds product-market fit. 

If you’re scoping a fintech features MVP and want a technical partner who understands both the product and compliance side of the equation, our team works with founders to turn a long feature wishlist into a launch-ready roadmap — one that’s secure, compliant, and built to scale from day one. 

Ready to define your MVP roadmap?  
 
Get in touch with our team at [email protected]